 |
Weather Eye with John Maunder |
Professor Ole Humlum, of the Institute of Geosciences, University of Oslo, Norway, maintains a very comprehensive climate web site and much of this WeatherEye is from his website.
A graph of five global monthly temperatures January 1979 to August/September 2016 is shown below.
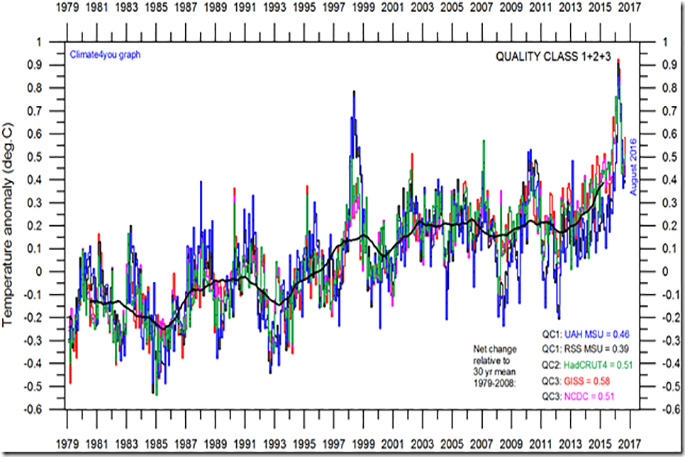
The graph shows a superimposed plot of Quality Class 1, and Quality Class 2, and Quality Class 3 global monthly temperature estimates from five international recording agencies
As the base period differs for the different temperature estimates, they have all been normalised by comparing to the average value of 30 years from January 1979 to December 2008.
The heavy black line represents the simple running 37 month mean of the average of all temperature records. The numbers shown in the lower right corner represent the temperature anomaly relative to the individual 1979-2008 averages.
For further information visit: https://sites.google.com/site/climatediceandthebutterfly/