 |
Weather Eye with John Maunder |
Global temperatures are compiled for various areas, including global (land-ocean), global (meteorological stations), three latitude bands, and hemispheric, by the Goddard Institute for Space Studies of NASA.
A graph of the global temperatures (for the land/ocean) from 1880 to 2013, show a general warming from 1910 to the early 1940s, a cooling from the early 1940s to the mid-1970s; and a general warming from the mid-1970s to about 1998.
However, since then, global annual temperatures have been relatively steady with no real cooling or warming.
The yearly global temperatures (expressed as differences from the 1951-1980 average), since 1998 are:
1998: +0.58 degrees Celsius
1999: +0.33 degrees Celsius
2000: +0.35 degrees Celsius
2001: +0.48 degrees Celsius
2002: +0.56 degrees Celsius
2003: +0.56 degrees Celsius
2004: +0.49 degrees Celsius
2005: +0.62 degrees Celsius
2006: +0.55 degrees Celsius
2007: +0.58 degrees Celsius
2008: +0.49 degrees Celsius
2009: +0.59 degrees Celsius
2010: +0.66 degrees Celsius
2011: +0.55 degrees Celsius
2012: +0.57 degrees Celsius
2013: +0.60 degrees Celsius
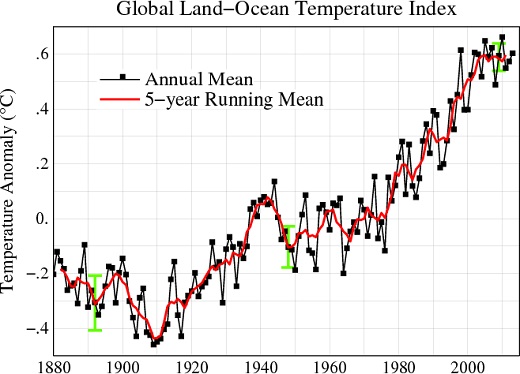
The green bars show the uncertainty estimates at various times.
For further information, see https://sites.google.com/site/climatediceandthebutterfly/