 |
Weather Eye with John Maunder |
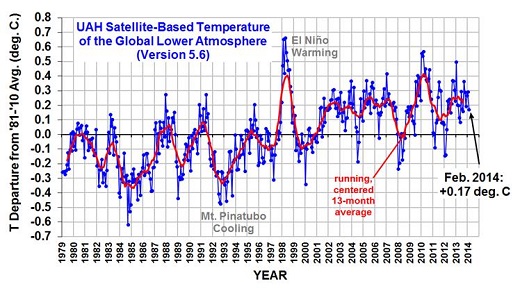
The latest global average temperatures of the troposphere – those observed from NOAA satellites – are computed by the University of Alabama at Huntsville, in the United States.
The chart shows since 1979, when reliable satellite observations have been available, there has been little overall trend (from the average temperatures during the 30-year period 1981 – 2010 in the temperatures in troposphere), apart from ‘normally expected' variations, except for a small warming trend.
The data for 2011 are as follows: January 0.0 degrees Celsius, February -0.02, March -0.10, April +0.12, May +0.14, June +0.32, July +0.38, August +0.33, September +0.29, October +0.12, November +0.12, December +0.10 degrees.
The data for 2012 are: January -0.09 degrees, February -0.12, March +0.11, April +0.29, May +0.29, June +0.37, July +0.28, August +0.34 , November +0.28, December +0.20 degrees.
The data for 2013 are: January +0.50 degrees, February +0.18, March +0.20, April +0.10, May +0.07, June +0.30, July +0.17, August +0,16, September +0.37, October +0.29, November +0.19, December +0.23 degrees.
The data for 2014 are: January +0.29 degrees Celsius, February +0.17 degrees Celsius.
The coolest months (since 1979) were September 1984 (-0.49 degrees Celsius) and November 1984 (-0.42 degrees Celsius), and the warmest months were February and April 1998 (both +0.76 degrees Celsius). The chart shows the ‘El Nino' warming in the 1998 period and the Mount Pinatubo (volcanic) cooling during the 1992 1193 period.
For further details on climate matters, see https://sites.google.com/site/climatediceandthebutterfly/