 |
Weather Eye with John Maunder |
Rainfalls for the month of August have been recorded in Tauranga since 1898, except for 1904, 1907, 1908 and 1909.
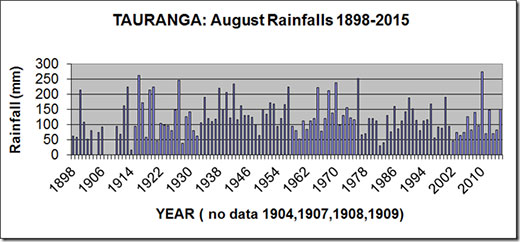
The graph shows the range of rainfalls from an extreme high of 274 mm in 2010 to a low of only 17 mm in 1914.
The second wettest August was 1916 when 263 mm was recorded, and the second driest August was in 1982 when only 31 mm fell.
The long-term average rainfall for Tauranga for August is 124 mm. The rainfall for Tauranga for August 2015 was 151 mm.
The graph of the August rainfall shows normal variations from year-to-year. There is a small decrease in the overall August rainfalls during the last 50 years – from 1961-2010 – from an average of 121 mm, compared with an average of 133 mm during the 50 years from 1911-1960.
Since 1898, there have been 11 August months with a rainfall of 220 mm or more – with 10 occurring during 1900 to 1976 – and only one August month since then 2010, which was the highest rainfall for any August. Only five August months have had rainfalls of 50 mm or less.
Chronologically, the 11 wettest August months are 1913, 1916, 1920, 1927, 1938, 1942, 1957, 1965, 1970, 1976 and 2010.
In contrast, chronologically the five driest August months are 1914, 1921, 1982, 1983 and 2002.
For further information on a variety of climate matters, see: https://sites.google.com/site/climaterisksandbenefits/