|
Weather Eye with John Maunder |
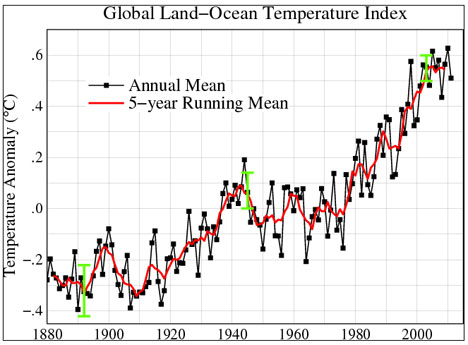
Global annual temperatures for various areas including global (land-ocean), global (meteorological stations), three latitude bands, and hemispheric, are prepared by the Goddard Institute for Space Studies of NASA.
The global temperature graph shows little change in global temperatures since 2000. This compares with little change from 1880 to about 1910, a general warming from 1910 to the early 1940s, a cooling from the early 1940s to the mid 1970s, a warming from the mid 1970s to about 2000, and little change during the last decade.
The likely causes of the cooling and the warming periods during the last 130 years are a combination of natural events (including solar activity, volcanic activity, and ocean currents) and the increases in human induced and animal induced greenhouse gases. These and other causes of climate change will be discussed in a later WeatherEye.
Since 1880, when comparative instrumental temperature records are available, the four coldest years according to the NASA site are 1890 and 1917 (both 0.39 degrees below the 1951-80 average), and 1877 and 1909 (both 0.35 degrees below the 1950-1980 average), and the four warmest years are 2010 (0.63 degrees above the 1951-80 average), 2005 (0.62 degrees above the 1951-80 average), and 1998 and 2007 (both 0.58 degrees above the 1950-80 average). The graph shows an increase in the global annual temperature, during the last 130 years, of about 0.8 degrees C. Some nations, and some people, may find this as either a risk, or an opportunity, or both. The implications of this will be discussed in a later WeatherEye.