 |
Weather Eye with John Maunder |
Rainfalls for the month of May have been recorded in Tauranga since 1898 (except for 1904, 1907, 1908, and 1909).
The graph shows the range of rainfalls from an extreme high of 634mm in 2005 to a low of 13mm in 2001.
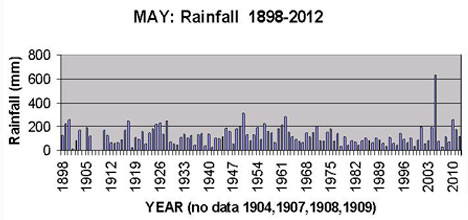
The second wettest May was 1950 when 311mm was recorded, and the second driest May was in 1918 when only 24mm fell. The long-term average rainfall for Tauranga for May is 124mm. The rainfall for May 2013 was 119.0 mm.
Apart from the exceptional rainfall of 634mm in May 2005, the graph shows a small decrease in the overall May rainfalls in the last 50 years (1961-2010) from an average of 115mm, compared with an average of 126mm in the 50 years from 1911-1960.
Since 1898, there have been 14 May months with a rainfall of 200mm or more, but only four May months with rainfalls of 30mm or less.
Of particular significance is the exceptional rainfall in May 2005. I estimate that such a rainfall is likely to occur in Tauranga only about twice in every 1000 years, which among things suggests central government could well have had a much more important role in relationship to the financial implications of the floods, which affected Tauranga during that month.
For further information Google 'Dr John Maunder” or see https://sites.google.com/site/theweatherclimateeye/ which list all my 'WeatherEyes” published in SunLive.