 |
Weather Eye with John Maunder |
Global monthly temperatures in the last 15 years have been relatively steady with no real cooling or warming.
Global temperatures are compiled for various areas including global (land-ocean), global (meteorological stations), three latitude bands, and hemispheric, by the Goddard Institute for Space Studies of NASA.
A graph of the global temperatures since 1890 shows a general warming from 1910 to the early 1940s, a cooling from the early 1940s to the mid-1970s, and a general warming from the mid-1970s to about 1998. However, since then global monthly temperatures have been relatively steady with no real cooling or warming.
The yearly global temperatures (expressed as differences from the 1951-80 average) since 1998 are: 1998, +0.58 degrees; 1999, +0.33; 2000, +0.35; 2001, +0.48; 2002, +0.56; 2003, +0.56; 2004, +0.49; 2005, +0.62; 2006, +0.55; 2007 +0.58; 2008, +0.44, 2009, +0.57 ; 2010, +0.63 ; 2011, +0.51 degrees; and 2012,
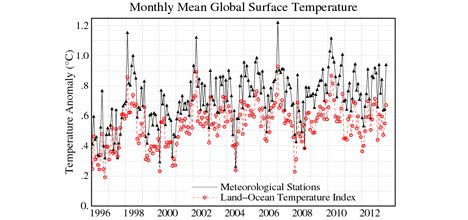
The graph shows the monthly mean global surface temperature anomaly from the base period 1951-1980. The black line shows meteorological stations only; the dotted line is the land-ocean temperature index obtained from satellite measurements.