 |
Weather Eye with John Maunder |
The below graph shows the range of Tauranga's October rainfalls, from an extreme high of 357 mm in 1916 to a low of only 7 mm in 1984.
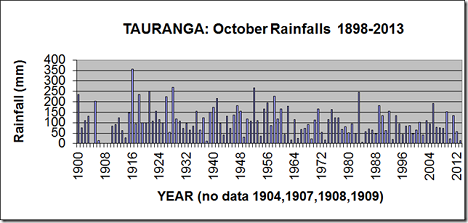
The second wettest October was 1928, when 269 mm was recorded; and the second driest October was in 1938, when only 11 mm fell. The long-term average rainfall for Tauranga in the month of October is 110 mm.
The graph of the October rainfall shows at first glance normal variations from year to year. However, there has been a notable decrease in the October rainfalls during the last few years.
Indeed, the average October rainfall in Tauranga for the 50-year period from 1961-2010 of 88 mm is only 70 per cent of the rainfall for the 50-year period 1910-1960.
Overall, the yearly rainfalls in Tauranga have declined during these two 50-year periods from an average of 1365 mm to 1263 mm.
However, the months of March and December each show increases in the rainfall for these same 50-year periods.
Since 1898, there have been 11 October months with a rainfall of 200 mm or more (10 of which occurred during the period 1900-1958), and only one October month since then has recorded this much. Plus, 10 October months have experienced rainfalls of 25 mm or less.
For a list of all my Weather Eyes, go to: https://sites.google.com/site/theweatherclimateeye/