|
Weather Eye with John Maunder |
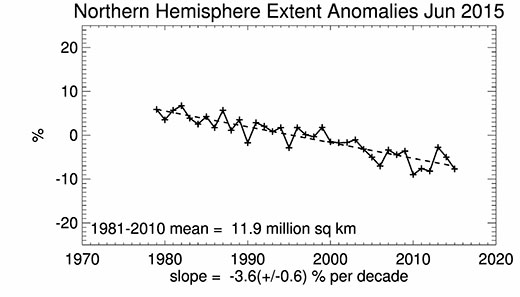
Arctic sea ice extent for June 2015 averaged 11.0 million square kilometers, the third lowest June extent in the satellite record. This is 920,000 square kilometers below the 1981 to 2010 long-term average of 11.89 million square kilometers and 150,000 square kilometers above the record low for the month observed in 2010.
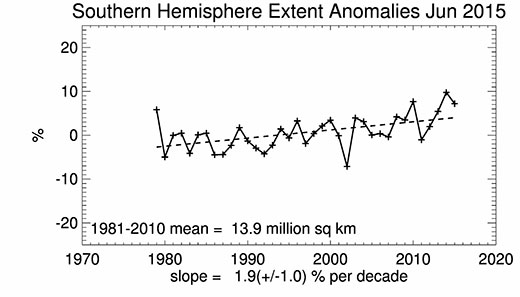
Sea ice extent in Antarctica averaged 14.93 million square kilometers , the third highest June extent in the satellite record. The extent was slightly greater than the 1981 to 2010 average almost everywhere around the continent. The high amount of sea ice in the eastern Weddell and Ross seas is consistent with the pattern observed for the past several months. Satellite data show unusually extensive sea ice growth along the western side of the Antarctic Peninsula. This new feature in sea ice growth could be influenced by the strong atmospheric wave-3 pattern that has persisted over the past few months. In a wave-3 pattern, there are three major low-pressure areas around the continent separated by three high-pressure areas.
The National Snow and Ice Data Centre, in Boulder, Colorado, has an extensive website on Arctic and Antarctic sea ice.
Graphs of the extent of the Northern Hemisphere and Southern Hemisphere ice – updated to June 2015 – from the above website are shown below.
These show from 1979 to 2015 the Northern Hemisphere ice extent decreased at the rate of 3.6 per cent per decade, compared with an increase of 1.9 per cent per decade during the same period in the Southern Hemisphere.